Fixed Income: Semi-Annual Review
THE BULL MARKET CONTINUES – DECOUPLING OF JAPAN
After a turbulent end of 2018 and volatile first weeks of 2019, global fixed income markets have found their footing again and posted positive returns for the first six months of 2019. All of Solactive’s major fixed income benchmarks have been in positive territory achieving year to date returns between 2.73% (Japanese Government Bonds) and 10.77% (USD HY Corporate Bonds).
On the government bond side, the recent rally in Eurozone government debt, mainly caused by comments from the ECB about potentially further loosening monetary policy, made our Solactive Eurozone Government Bond Index the best performing index among its peers, returning 6% this year. While the yield on our US Treasury index dropped more than our Solactive’s Eurozone Government Bond Index yield, the higher duration of the latter is the reason for the Eurozone’s outperformance. Interestingly, Japan has recently decoupled from the other government bond indices. As you can see below, the other government bond indices moved in lockstep over the past six months.
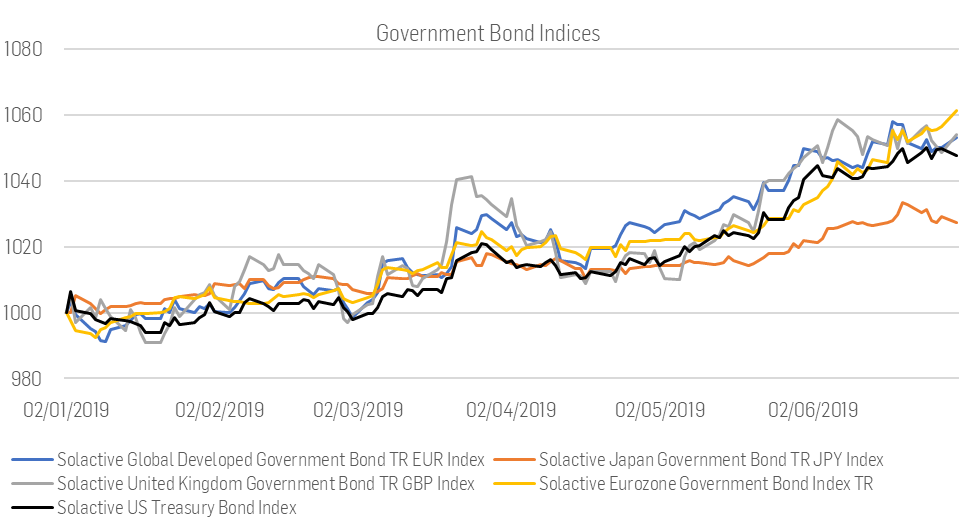
Figure 1: Performance of Government Bond Indices 01.01.2019 to 30.06.2019, all indices are in local currency, except Solactive Global Developed Government Bond TR EUR Index
On the corporate debt side, the undisputed champion remains our Solactive USD High Yield Corporate Index, which has returned 10.77% so far, and thus has been the best performing corporate bond index for most 2019. This shouldn’t come as a surprise as the current situation for USD corporate debt is quite favorable. During 2019 we have seen a relatively high yield level in the USD space, dropping US Treasury yields and narrowing spreads for USD corporates relative to the US Treasury Bonds. In the USD high yield space, the supply and demand mechanics supported index levels as well, with USD high yield net issuance being negative for the first two month of 2019.
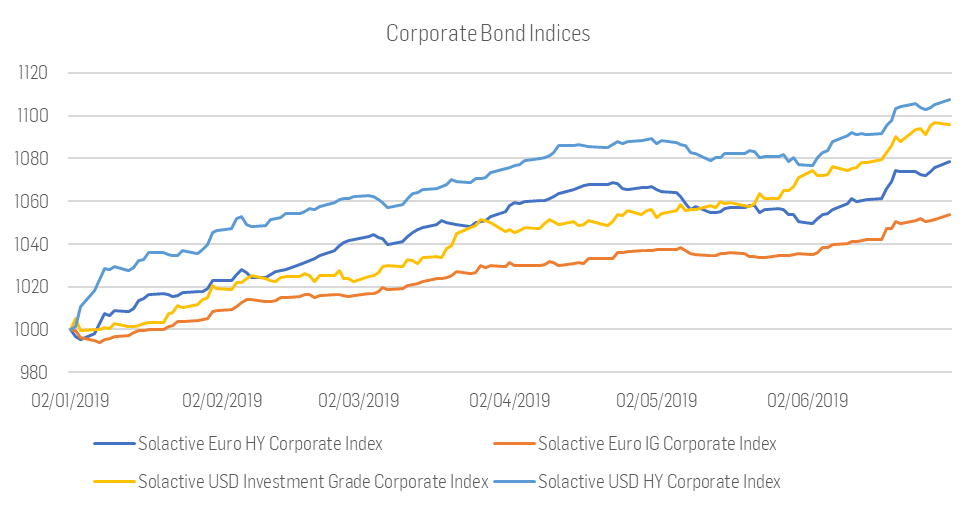
Figure 2: Performance Corporate Bond Indices 01.01.2019 to 30.06.2019
LOWER YIELDS EVERYWHERE – JAPAN EVEN NEGATIVE
Yields have dropped for all major sovereign bond indices in the first half of 2019. The yield of the Solactive Japan Government Bond TR JPY Index (Duration of 11.1) has recently turned negative. The US Treasury Index yield dropped by approx. 60 bps from 2.6% to 1.96%. As discussed before, the monetary policy environment in the US was very supportive for US Corporates.
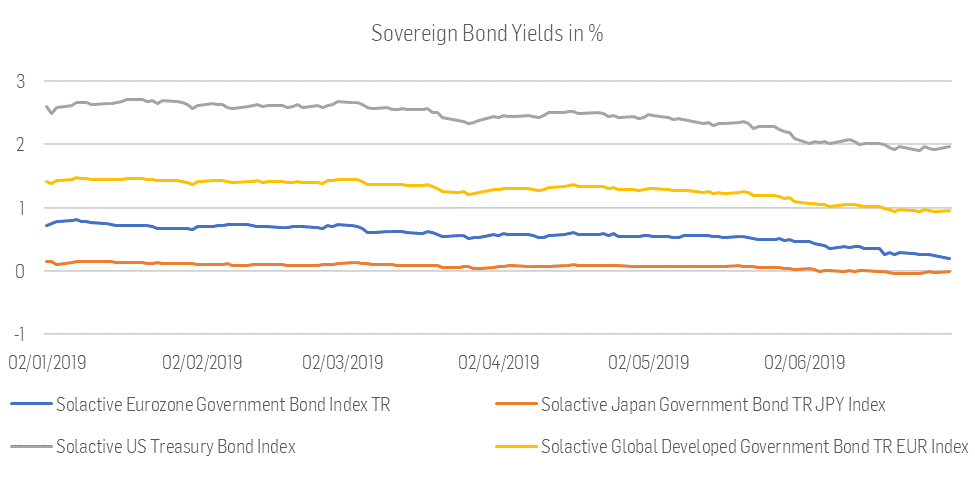
Figure 3: Sovereign Bond Yields in %
LOWER YIELDS 2.0 – SPREAD COMPRESSION
Looking at corporate bond yields, the picture is quite similar: The yield level in the USD is substantially higher than in the EUR area. Interesting are the recent movements in the yield differentials: While European corporates spreads widened a bit in the last 30 days, their USD counterparts narrowed further. The Euro Corporate IG – Euro Sovereign yield differential is now at 52 bps, while the USD Corporate IG – US Treasury yield differential is currently at 128 bps.
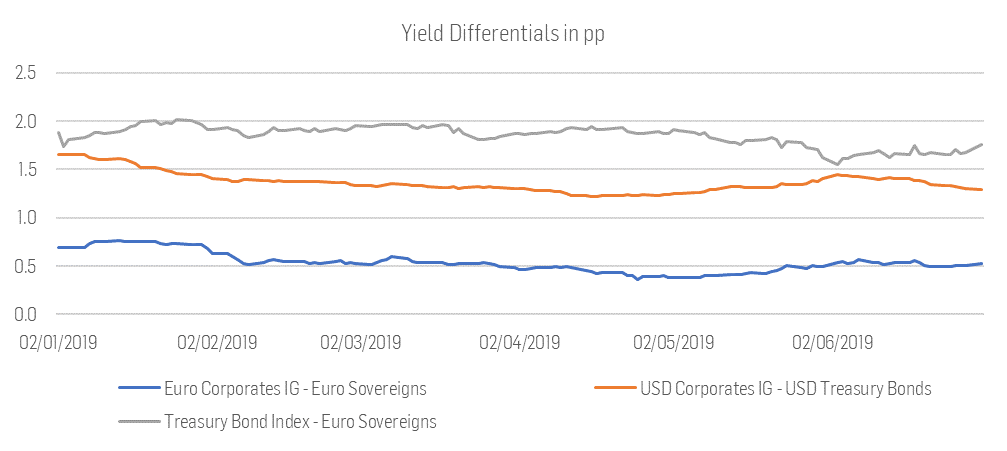
Figure 4: Yield Differentials in pp
On a relative basis, European corporate debt bonds are more expensive than their USD denominated counterparts. Within the corporate bond market, Euro high yield bonds carry a premium of 2.88 pp over Euro IG bonds while USD High yield index only offers a premium of 2.70 pp against the USD Investment Grade Index.
SOLID INVESTMENT GRADE SUPPLY – HIGH YIELD SHAKY
The following graphs show the net new issuance in our corporate bond benchmarks as well as the aggregated market value. Generally, net issuance in the investment grade space has been strong. Our Euro Corporate IG and USD Investment Grade Corporate indices have been growing constantly in terms of the number of bonds as well as measuring the aggregate market value of all bonds.
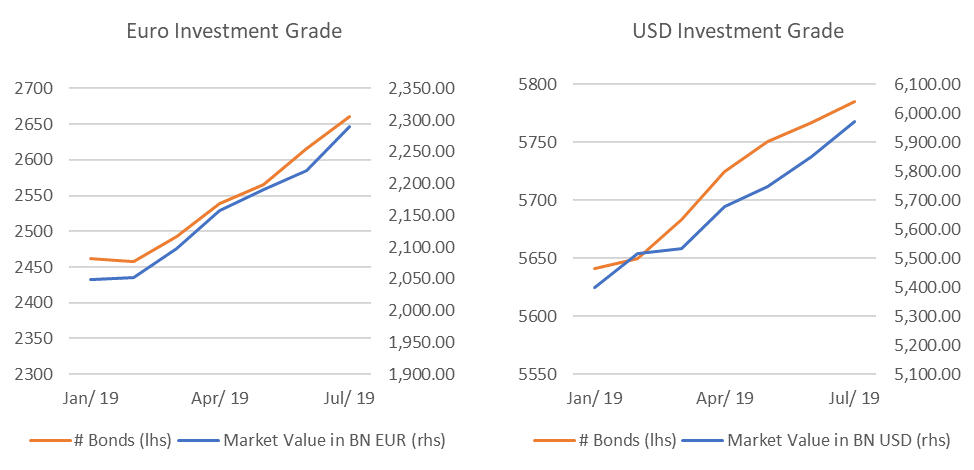
Figure 5: Investment Grade Bond Index Sizes
In the high yield markets, the picture differs. In general, net new issuance in the yield high yield markets has been a bit shaky in the last 6 months. Especially in the USD high yield space net new issuance has been negative year to date, with the index size (#number of bonds) steadily declining since April. European issuers seem to have taken advantage of the recent drop in yields as the index size has increased steadily since the beginning of May.
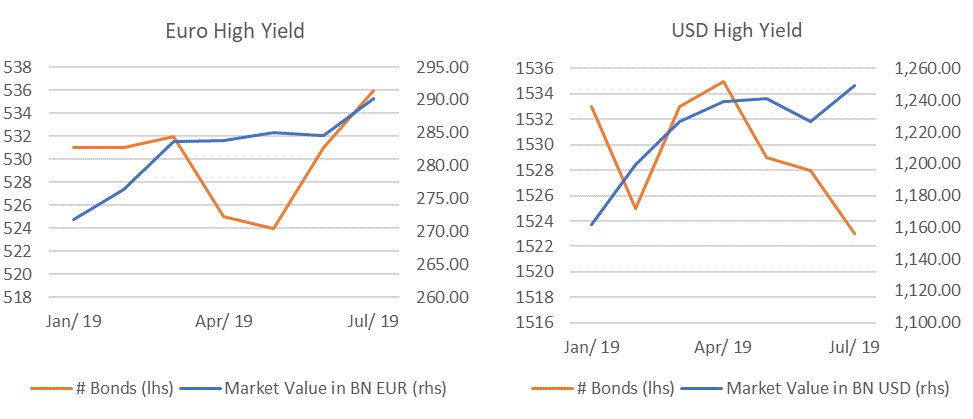
Figure 6: High Yield Bond Index Sizes
Sebastian Alber
Fixed Income Indexing Product Development